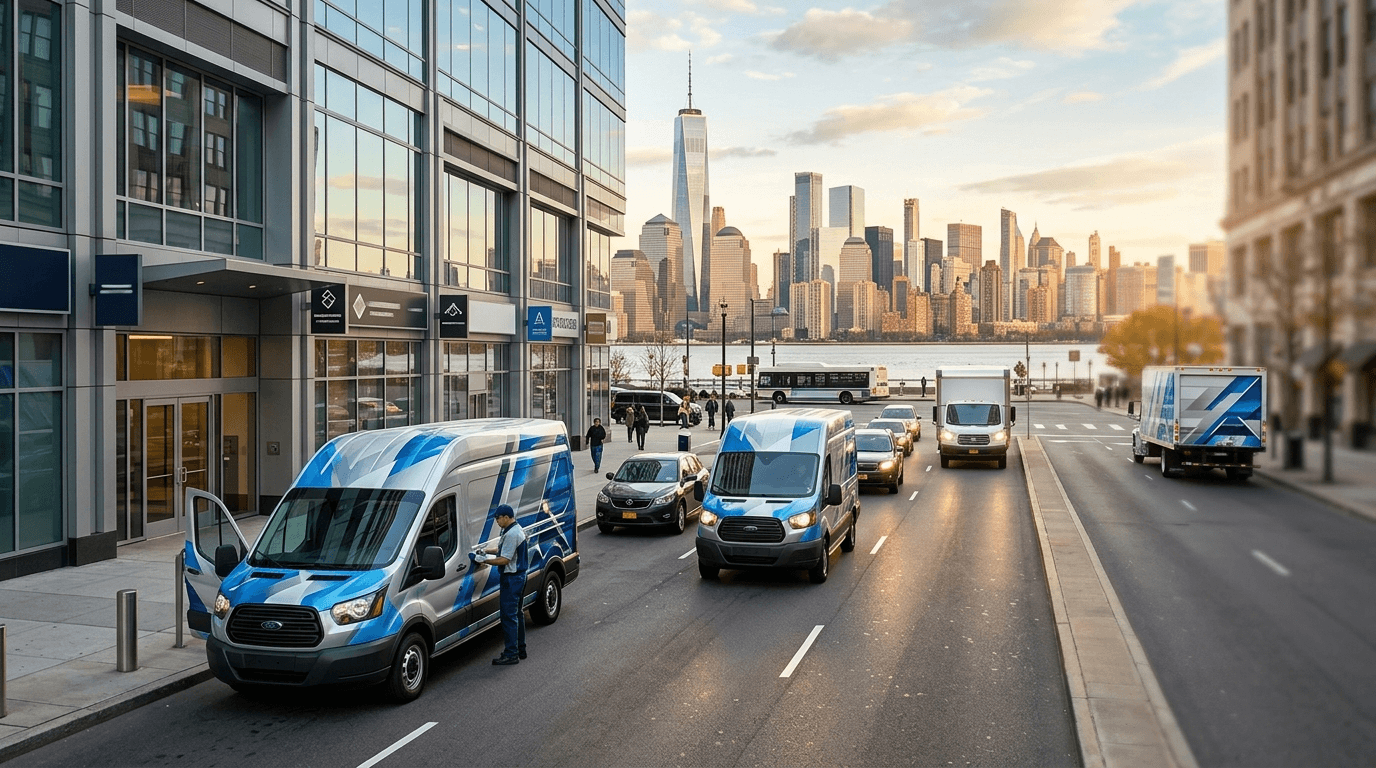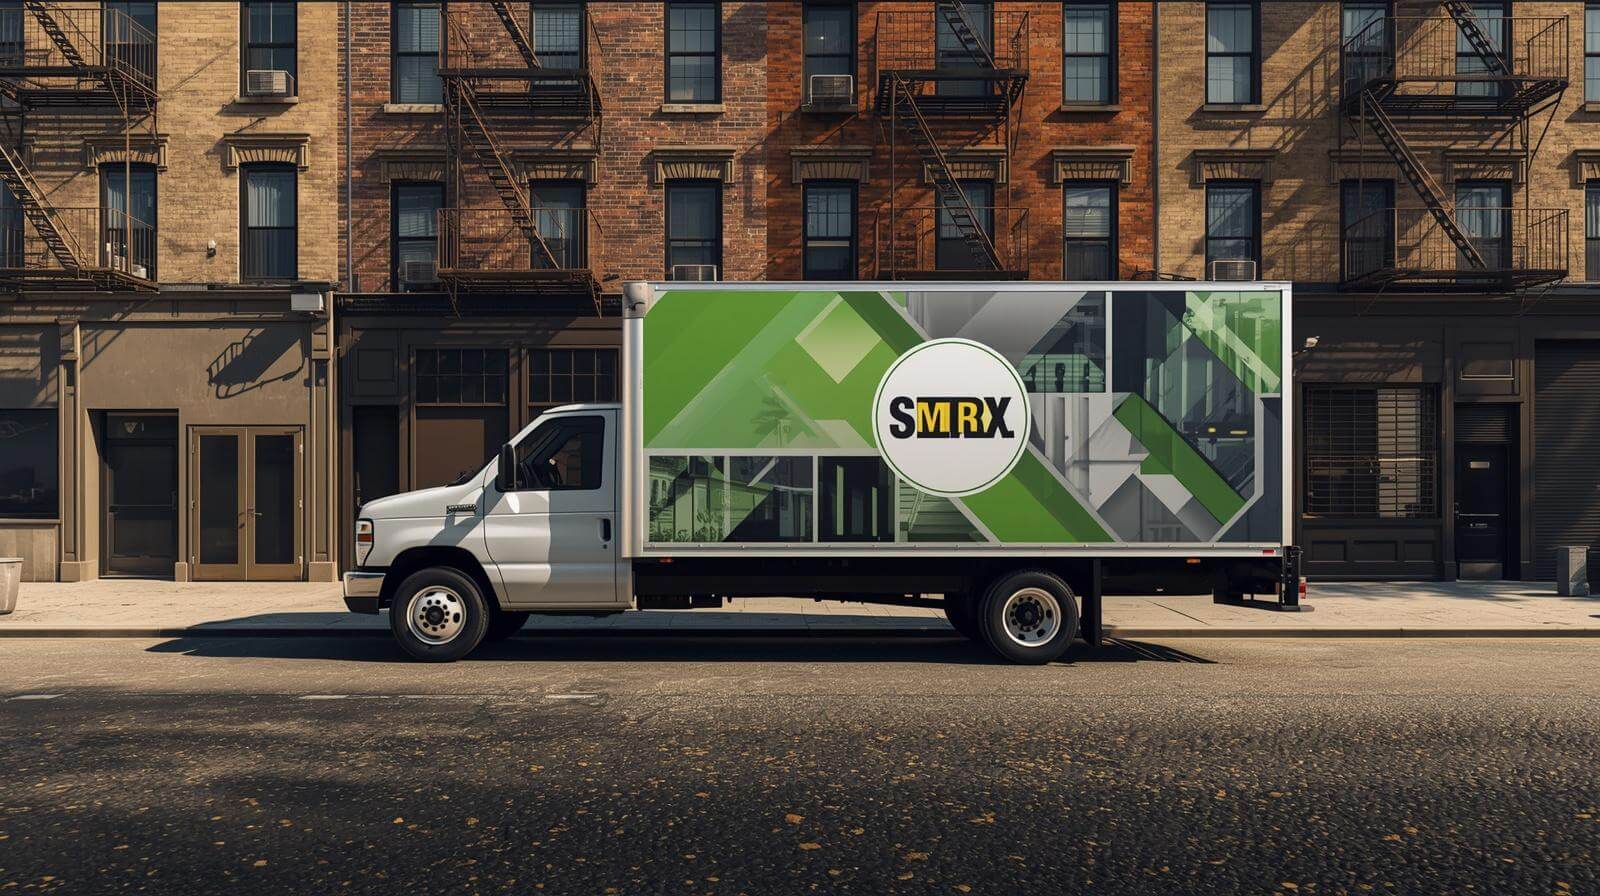
Vehicle wraps work differently from digital advertising. A customer may see a branded van several times, remember the company name, search for it later, and call from a Google Business Profile. The wrap influenced the lead, but the final interaction may be recorded as organic search or a local listing.
This makes vehicle wrap ROI harder to measure—but not impossible.
Businesses can track wrap performance through dedicated phone numbers, short URLs, landing pages, QR codes, customer-source questions, branded search activity, route information, and lead records. The strongest measurement system uses several of these methods together rather than relying on one impression estimate.
At Pixel Wraps, we design fleet graphics to make the company name, service, and response method easy to recognize. Businesses can strengthen that investment by deciding how performance will be measured before the graphics are printed.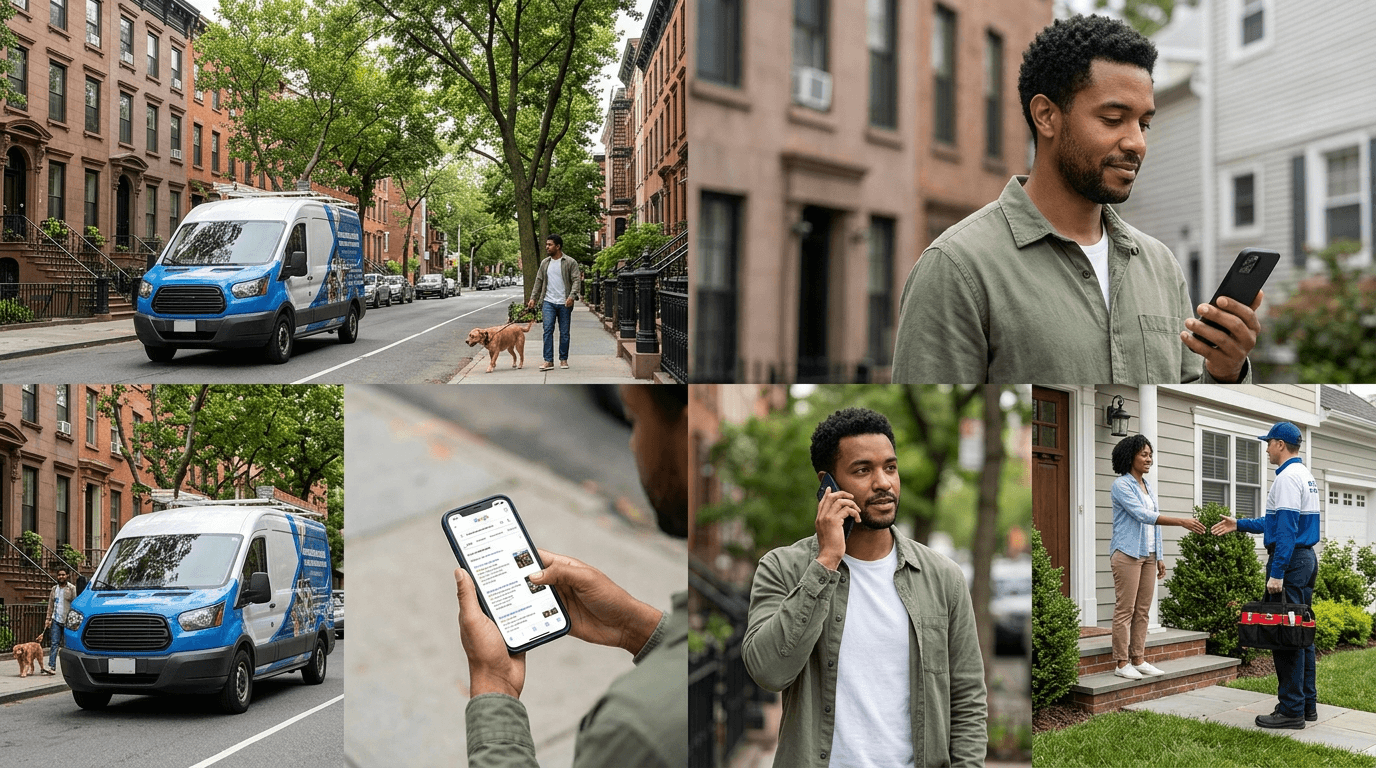
Start by Defining What ROI Means
Return on investment is often discussed as though it were the same as visibility.
Visibility is valuable, but it is not the final business result. A wrap can generate attention without producing qualified leads. It can also influence customers without receiving direct credit in the company’s analytics.
A practical ROI analysis separates the results into three levels.
Exposure
The vehicle operated in areas where potential customers could see it.
Possible exposure indicators include:
- Miles driven
- Hours on the road
- Number of active vehicles
- Route density
- Time parked in visible locations
- Neighborhoods or service areas covered
- Events attended
- Days in operation
Response
Someone took an action after seeing or remembering the vehicle.
Possible response indicators include:
- Calls to a tracked number
- Visits to a dedicated landing page
- QR-code scans
- Direct website visits
- Branded searches
- Google Business Profile interactions
- Quote requests
- Mentions of the vehicle in a form or conversation
Business Outcome
The response became a commercially meaningful result.
Track:
- Qualified leads
- Estimates issued
- Appointments scheduled
- Jobs won
- Revenue
- Gross profit
- Repeat business
- Customer lifetime value
A successful measurement system connects exposure to response and response to business outcome as closely as practical.
Establish a Baseline Before Wrapping the Vehicles
It is difficult to measure improvement without knowing what happened before the graphics were installed.
Record a baseline for at least several weeks, and preferably longer if the business experiences seasonal demand.
The baseline may include:
- Monthly inbound calls
- Website form submissions
- Direct website traffic
- Branded search traffic
- Google Business Profile interactions
- Leads by service area
- Quotes issued
- Jobs closed
- Average job value
- Lead-to-sale rate
- Marketing source reported by customers
The comparison period should account for normal business fluctuations. A landscaping company wrapping vehicles at the start of spring should not assume every seasonal increase came from the new graphics. An HVAC company may experience higher demand during extreme weather regardless of advertising.
The baseline gives the business a reference. It does not create perfect attribution, but it makes the analysis more defensible.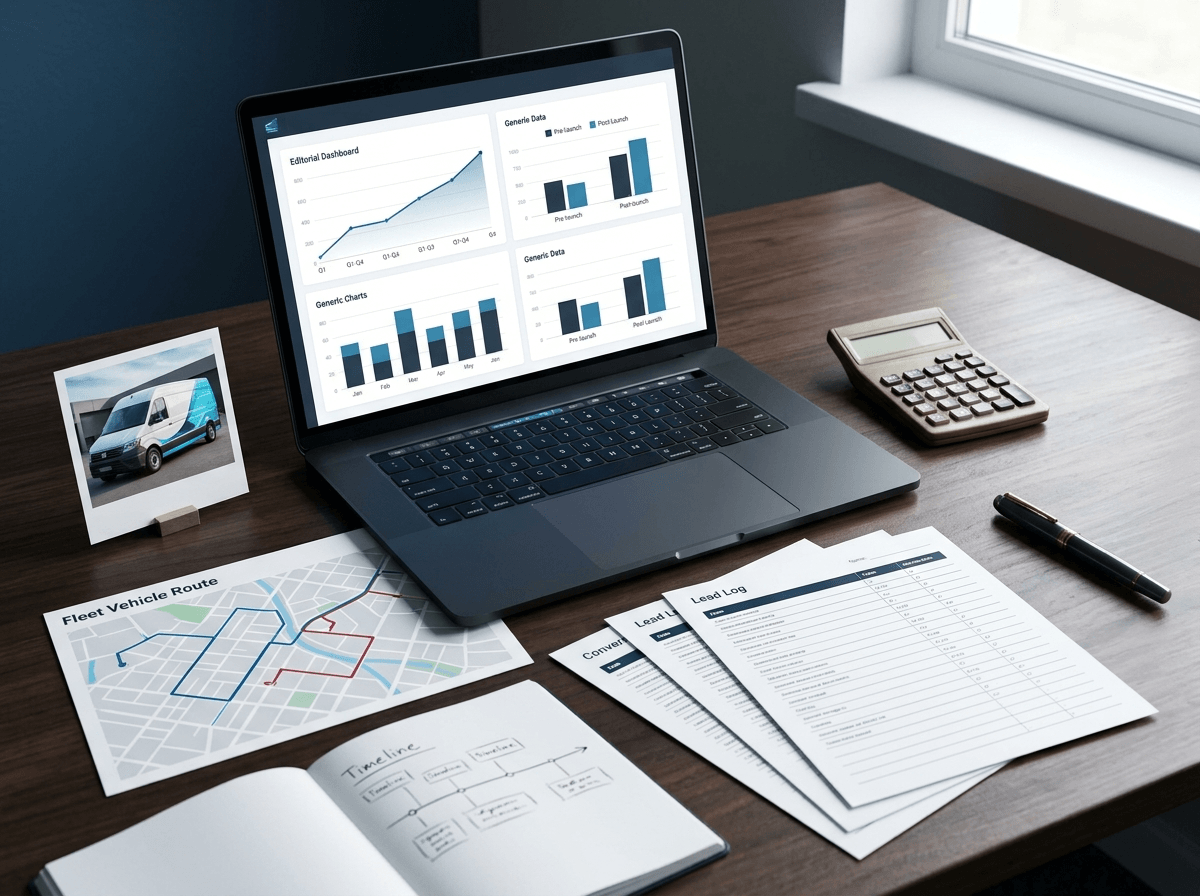
Set a Measurement Period That Matches the Investment
Vehicle wraps are not short-term ads unless they are intentionally produced for a temporary campaign.
A business should not judge a long-term fleet wrap based only on the first seven days. The graphics may remain in use for years, and brand recognition can grow through repeated exposure.
Useful review points can include:
- First 30 days
- First 90 days
- Six months
- One year
- Annual review for the remaining wrap life
The early period helps confirm that tracking tools work. Longer periods reveal how wraps perform across seasons and normal operating cycles.
Businesses should also record the date each vehicle entered service. If a fleet is wrapped in phases, measuring every unit from one shared launch date will distort the results.
Calculate the Complete Wrap Investment
The project cost should include more than the printed vinyl.
Depending on the scope, the total investment may include:
- Design
- Vehicle measurements or surveys
- Printing
- Lamination
- Installation
- Existing graphic removal
- Surface preparation
- Vehicle transportation
- Operational downtime
- Repairs required before wrapping
- Tracking number or landing-page setup
- Replacement graphics
- Maintenance
- Removal at the end of the program
Some of these costs would exist even without a wrap, so businesses should avoid adding unrelated vehicle expenses to the campaign.
The objective is to identify the amount spent specifically to create, install, maintain, and measure the graphics.
Use Gross Profit Instead of Revenue When Possible
Revenue does not show how much the company actually earned from the work.
If a wrapped vehicle generates a $10,000 project but labor, materials, subcontracting, and direct fulfillment cost $7,000, the business did not receive a $10,000 return. Its gross profit from the project was $3,000.
A more useful formula is:
Vehicle Wrap ROI = (Attributable Gross Profit − Wrap Campaign Cost) ÷ Wrap Campaign Cost × 100
For example:
- Total wrap campaign cost: $12,000
- Attributable revenue: $30,000
- Estimated gross profit from that revenue: $15,000
ROI = ($15,000 − $12,000) ÷ $12,000 × 100
ROI = 25%
The calculation becomes more valuable when it uses qualified sales data instead of impressions alone.
If reliable gross-profit information is unavailable, revenue can still be tracked, but it should be labeled as return on ad spend or revenue generated—not net business return.
Amortize the Cost Over the Useful Campaign Period
A wrap is generally paid for once but used over an extended period.
A business can divide the initial investment across the expected campaign life to understand the monthly or annual cost.
Monthly Wrap Cost = Total Campaign Cost ÷ Months in Active Use
If a fleet graphics project costs $18,000 and remains active for 48 months:
$18,000 ÷ 48 = $375 per month
This does not guarantee a specific lifespan or result. Vehicle exposure, film selection, installation, maintenance, orientation, climate, and operating conditions all affect useful life.
3M recommends that fleet owners consider durability, installation, maintenance, removal, and warranty together when evaluating fleet graphic films. 3M fleet-wrap film factors
The monthly-cost view helps compare the wrap with recurring advertising channels, but the comparison should use actual business results rather than estimated exposure alone.
Assign a Dedicated Phone Number
A dedicated call-tracking number is one of the clearest ways to identify direct responses.
The number shown on the vehicle forwards to the company’s regular phone system. Calls to that number can be counted separately and connected to the fleet graphics campaign.
Track:
- Total calls
- Unique callers
- Call duration
- Qualified calls
- Appointments
- Quotes
- Closed sales
- Revenue or gross profit
The number should be easy to read and remember. Avoid changing it during the life of the wrap unless the old number can remain active and forwarded.
Call tracking also needs responsible handling. Businesses should comply with applicable call-recording and privacy requirements and inform callers where required.
Use One Number or Several?
A company can place one tracking number across the full fleet or assign different numbers to branches, regions, or vehicle groups.
One number is simpler and creates a consistent design.
Multiple numbers can provide more detail but may complicate:
- Artwork
- Production
- Future repairs
- Number ownership
- Call routing
- Data analysis
- Fleet consistency
Most local fleets will benefit from one stable number unless there is a specific reason to separate regions or divisions.
Use a Short, Dedicated Website Address
A short URL can identify visitors who respond to the vehicle.
Instead of sending people to a complicated page, use an address such as:
company.com/van
company.com/road
company.com/quote
The visible URL should remain short enough to read and remember. It can redirect to a campaign landing page containing properly tagged analytics parameters.
Google Analytics supports campaign parameters that help identify which campaign referred website traffic. These parameters can appear in acquisition reporting when visitors use a properly configured campaign URL. Google Analytics campaign URL guidance
The landing page can include:
- Brief service description
- Service area
- Project examples
- Reviews
- Contact form
- Tap-to-call button
- Quote request
- Campaign-specific offer
- Clear next step
The page should load quickly and work well on mobile devices. Someone remembering a vehicle later should not reach a slow, confusing, or unrelated page.
Use QR Codes Selectively
A QR code can provide a measurable response because each scan can lead to a tagged landing page.
However, a QR code is not appropriate as the primary response method on every vehicle. People should not be encouraged to scan moving vehicles. Codes are more useful when the vehicle is:
- Parked at a job site
- Displayed at an event
- Stopped in a service area
- Used as a food truck
- Positioned at a trade show
- Parked outside a business
- Viewed by pedestrians
The code should be large enough, high contrast, and placed on a relatively flat area. It should be tested from realistic viewing distances before production.
The destination URL should also be controlled by the business so it can remain active throughout the wrap’s useful life.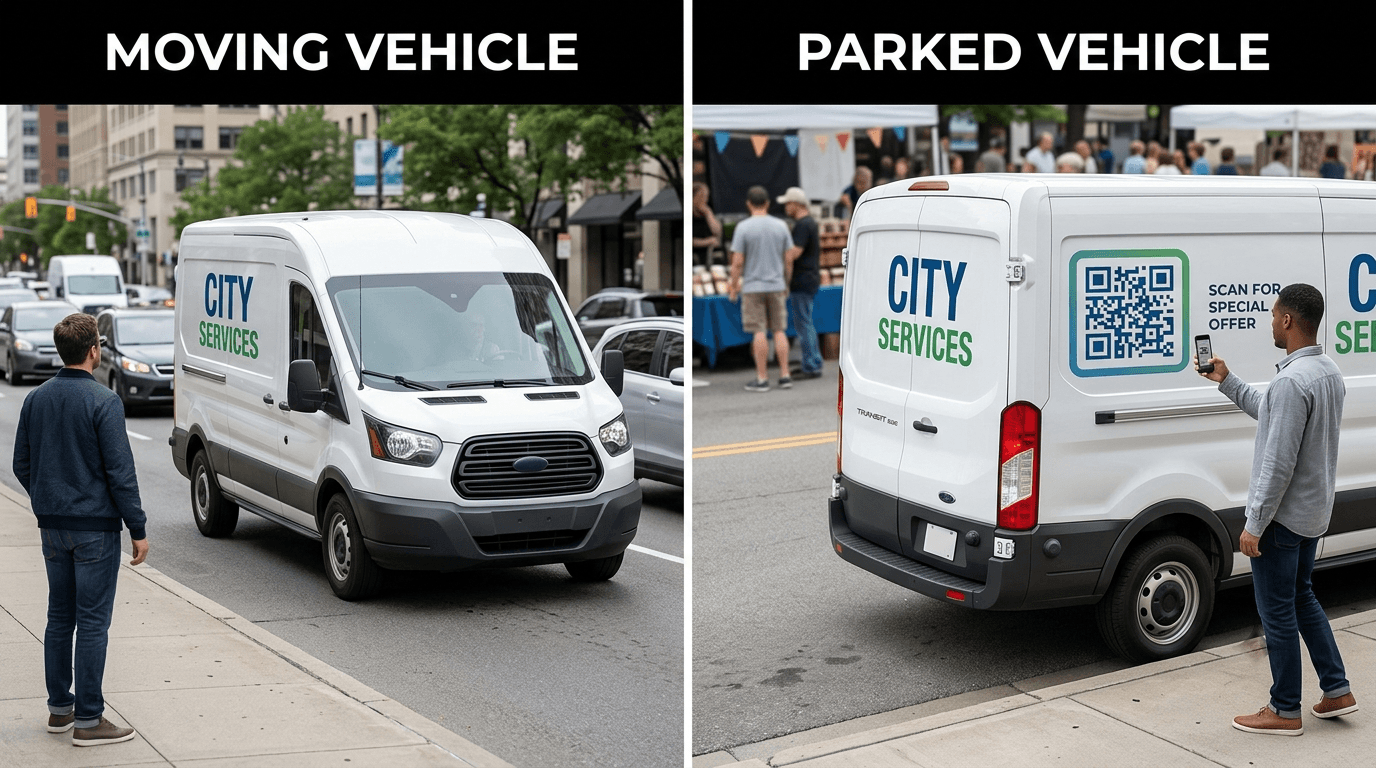
Ask Every New Lead How They Found the Business
Some of the most useful wrap-attribution data comes from one simple question:
How did you hear about us?
Add this question to:
- Phone scripts
- Website forms
- Estimate forms
- CRM intake
- In-person inquiries
- Customer surveys
- Appointment booking
- Sales follow-up
Provide “company vehicle or truck” as a selectable option, but allow customers to explain in their own words.
Sales and office staff should record the answer consistently. Entries such as “van,” “saw truck,” “vehicle,” and “road ad” should be grouped under one standardized source.
The question is not perfect. Customers may forget or name the last interaction instead of the first. Still, consistent collection over time can reveal patterns that analytics platforms miss.
Track Branded Search Activity
A person may see a wrapped vehicle, remember the company name, and search for it later. The website visit may appear as organic search even though the vehicle created the awareness.
Monitor changes in:
- Searches for the company name
- Searches for common misspellings
- Direct website traffic
- Google Business Profile views
- Website clicks from the Business Profile
- Calls from the Business Profile
- Direction requests
- Searches combining the brand and service
- Searches combining the brand and location
Google Business Profile performance reporting includes searches, views, and customer interactions such as website clicks, calls, and direction requests. Google Business Profile performance guidance
These increases cannot automatically be attributed entirely to the wraps. Other marketing, seasonality, reviews, public relations, and existing customer activity may also influence branded searches.
The data is most useful when reviewed alongside installation dates, routes, call tracking, and customer-source responses.
Record Route and Service-Area Data
A wrapped vehicle creates little marketing value while stored inside a private facility. Its potential exposure depends on where and how it operates.
Fleet managers can record:
- Daily or weekly mileage
- Main service territories
- Recurring routes
- Time spent in customer neighborhoods
- High-traffic travel corridors
- Time parked at job sites
- Event participation
- Branch assignment
- Number of active days
- Seasonal route changes
GPS fleet data may already contain much of this information. The company does not need to track individual viewers to understand whether a vehicle regularly appears in areas containing potential customers.
Route data can help answer questions such as:
- Which vehicles receive the most public exposure?
- Which service areas produce more wrap-reported leads?
- Do parked job-site vehicles generate neighborhood inquiries?
- Which routes justify stronger rear or side graphics?
- Should future vehicles receive different campaign URLs by region?
Route exposure is an indicator, not proof of a sale. It becomes more meaningful when combined with response data.
Track Leads by Geography
Local service businesses can compare lead locations with fleet activity.
For example, an HVAC company may notice more branded searches and quote requests in neighborhoods where wrapped vans regularly complete service calls. A contractor may receive inquiries from properties near a long-running job site where its trucks are parked.
Track:
- Lead ZIP code
- City or neighborhood
- Vehicle service area
- Route or branch
- Job-site location
- Source reported by the customer
- Date of inquiry
- Date the wrapped vehicles entered the area
This can reveal areas where vehicle visibility and customer demand overlap.
Do not assume causation from geography alone. The business may already have customers, referrals, or digital campaigns in that area. The strongest evidence occurs when geography aligns with tracked calls, customer reports, and route timing.
Create a Dedicated CRM Source
Vehicle graphics should have their own marketing-source category.
Do not group them under vague entries such as “other,” “offline,” or “advertising.” A dedicated category makes reporting and comparison easier.
A simple source structure could include:
- Vehicle wrap
- Customer referral
- Organic search
- Google Business Profile
- Paid search
- Social media
- Direct mail
- Building sign
- Event
- Repeat customer
- Other
For more detail, add a secondary field:
- Saw vehicle on road
- Saw vehicle parked
- Saw vehicle at job site
- Scanned QR code
- Used vehicle phone number
- Visited vehicle URL
- Remembered company name
- Unknown vehicle interaction
The source should remain consistent across salespeople, branches, and reporting periods.
Separate Leads From Qualified Opportunities
A wrap may generate calls that are outside the service area, unrelated to the offered work, or too small for the business.
Counting every call as an equal result can exaggerate performance.
Track the progression:
- Response
- Qualified lead
- Estimate or appointment
- Sale
- Revenue
- Gross profit
Useful rates include:
Lead Qualification Rate = Qualified Leads ÷ Total Wrap Responses
Close Rate = Wrap-Attributed Sales ÷ Qualified Wrap Leads
Cost per Qualified Lead = Campaign Cost Allocated to Period ÷ Qualified Wrap Leads
Customer Acquisition Cost = Campaign Cost Allocated to Period ÷ New Wrap-Attributed Customers
This shows whether the vehicle design is attracting the type of customer the business actually wants.
Compare Performance Across Vehicles Carefully
Businesses may want to know which wrapped vehicle performs best.
That comparison is only useful if the vehicles have different tracking numbers, URLs, QR codes, or route records. Even then, exposure conditions may vary greatly.
A van driving daily through Manhattan cannot be compared directly with a backup truck operating twice a week in a lower-density area.
Compare vehicles using context:
- Active days
- Miles driven
- Route density
- Customer-facing hours
- Tracked responses
- Qualified leads
- Vehicle type
- Graphic coverage
- Service area
- Seasonal use
The goal is not to declare one body style universally superior. It is to identify which vehicles and routes contribute most effectively to the company’s marketing system.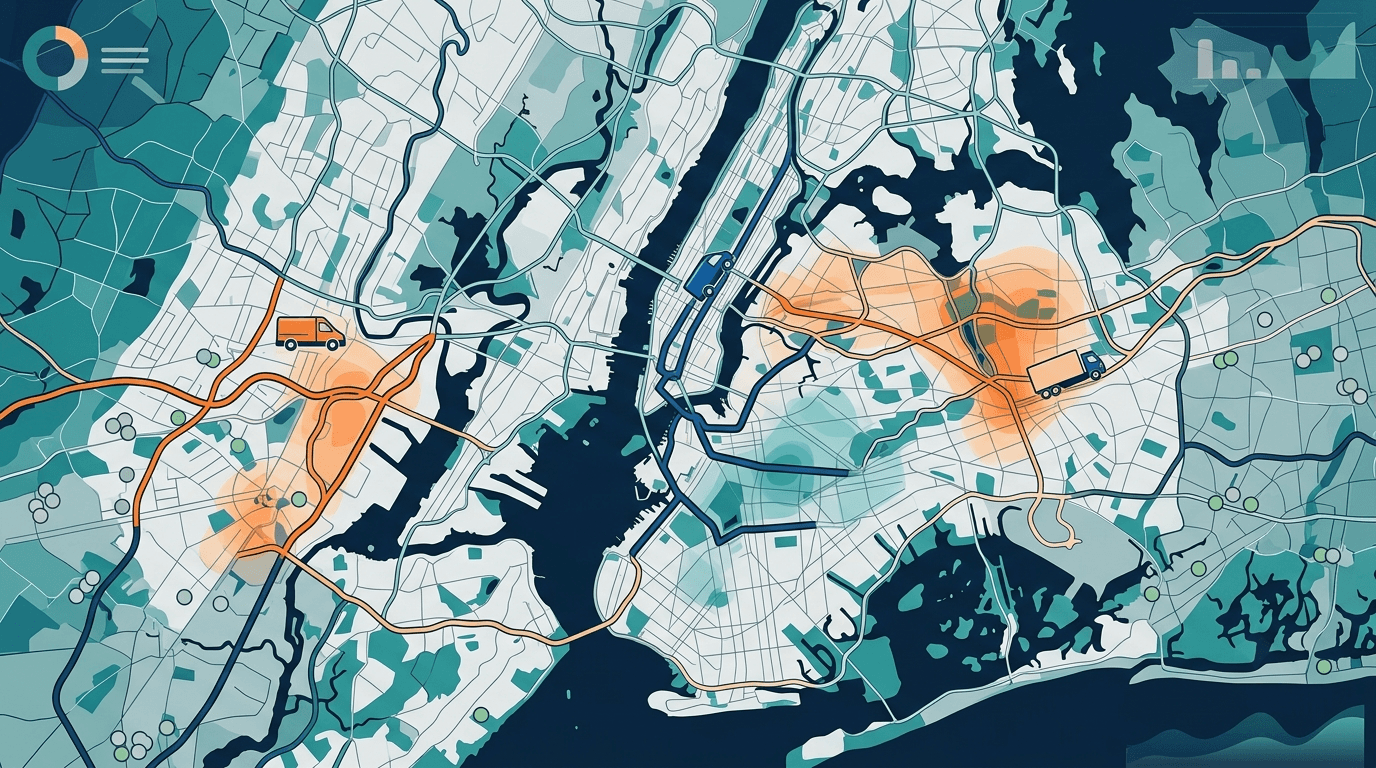
Avoid Relying Only on Impression Estimates
Vehicle advertising is often promoted using broad estimates of daily impressions. These numbers can help explain potential exposure, but they do not show how many people noticed the message, remembered the company, needed the service, or became customers.
Impression estimates vary according to:
- Market
- Traffic volume
- Route
- Vehicle movement
- Parking location
- Time of day
- Number of active vehicles
- Viewing angle
- Graphic design
- Vehicle size
- Measurement method
An impression should not be counted as a lead or sale.
Businesses can use exposure estimates for planning, but ROI decisions should prioritize tracked responses, qualified leads, closed work, and gross profit.
Account for Brand Influence That Cannot Be Directly Tracked
Not every useful result will be attributed perfectly.
A customer may:
- See the vehicle several times
- Receive a referral from a friend
- Search the company name
- Read reviews
- Visit the website
- Call through Google
- Become a customer
Which channel deserves credit?
The vehicle may have introduced the brand, while search and reviews helped the customer decide. Treating the final click as the only source understates the vehicle’s role. Giving the wrap full credit would overstate it.
For a more balanced analysis, report results in two groups.
Directly Attributed Results
These include:
- Dedicated phone-number calls
- Dedicated landing-page visits
- QR-code scans
- Customers explicitly reporting the vehicle
Wrap-Influenced Results
These may include:
- Increase in branded searches
- Increase in direct traffic
- Increased Google Business Profile activity
- Leads from areas with active fleet routes
- Customers who recognized the company from the road
Keep the categories separate so the report does not present influenced activity as confirmed direct attribution.
Build a Simple Monthly Wrap Performance Report
A practical report does not need to be complicated.
Track:
| Metric | Monthly Result |
| Active wrapped vehicles | |
| Estimated active days | |
| Fleet mileage | |
| Tracked phone calls | |
| Landing-page visits | |
| QR scans | |
| Vehicle-reported inquiries | |
| Qualified leads | |
| Estimates issued | |
| Jobs won | |
| Attributable revenue | |
| Estimated gross profit | |
| Monthly allocated wrap cost | |
| Cost per qualified lead | |
| Estimated ROI |
Add notes for major changes such as:
- New vehicles entering service
- Vehicles temporarily unavailable
- Seasonal demand
- New service areas
- Other marketing campaigns
- Website changes
- Major events
- Phone-tracking problems
This makes the report easier to interpret over time.
Design the Wrap to Support Measurement
Tracking will not help if the graphics are difficult to read.
The vehicle should make the response path clear. A potential customer needs to understand:
- Who the company is
- What it does
- How to respond
- Which information matters most
Depending on the design, the response method may be:
- Memorable company name
- Short website
- Readable phone number
- QR code for parked exposure
- Simple call to action
Avoid placing several phone numbers, long web addresses, social handles, QR codes, and too many calls to action on the same vehicle. Too many response options can weaken the hierarchy.
Pixel Wraps designs commercial vehicle graphics around real viewing conditions. We balance branding, service identification, and contact information so the graphics can support both recognition and measurable response.
Measure the Result Without Losing Sight of the Brand
Vehicle wraps can produce direct leads, but direct response is not their only role.
A consistent fleet can also support:
- Brand recognition
- Professional appearance
- Trust before an appointment
- Familiarity in the service area
- Reinforcement of other advertising
- Recognition at job sites
- Visibility for new services
- Consistency across locations
These benefits should not replace performance tracking, but they should be included in the business evaluation.
A vehicle graphic may influence a customer before the first call and continue reinforcing the decision after the job is booked.
Build a Measurable Fleet Graphics Program With Pixel Wraps
Pixel Wraps helps businesses create commercial vehicle graphics with a clear visual hierarchy and practical response path.
Our team manages:
- Fleet wrap design
- Full and partial wraps
- Vehicle lettering
- Tracked-number placement
- Short URL placement
- QR-code integration
- Fleet-wide graphic consistency
- Material selection
- In-house printing and lamination
- Certified installation
- Replacement graphics
- Future fleet additions
We work with commercial fleets throughout New York City, New Jersey, Pennsylvania, and the tri-state area. Contact Pixel Wraps with your vehicle list, service area, branding, and measurement goals. We will help develop fleet graphics that can be recognized on the road and connected to meaningful business results.